
What is Price Action in Trading and why it is important?
#price #action #trading #investing #priceaction #ikkinomics
Price action
Price action refers to the movement of a security's price plotted over time. It is the raw data from which all technical analysis tools and trading strategies are built.
It's the most fundamental aspect of technical analysis.
Price action trading relies on the use of past price movements to make trading decisions and does not incorporate fundamental analysis or news events.
Instead, traders focus on patterns, trends, and other signals that emerge directly from the price movements themselves.
Understanding Price Action Representation
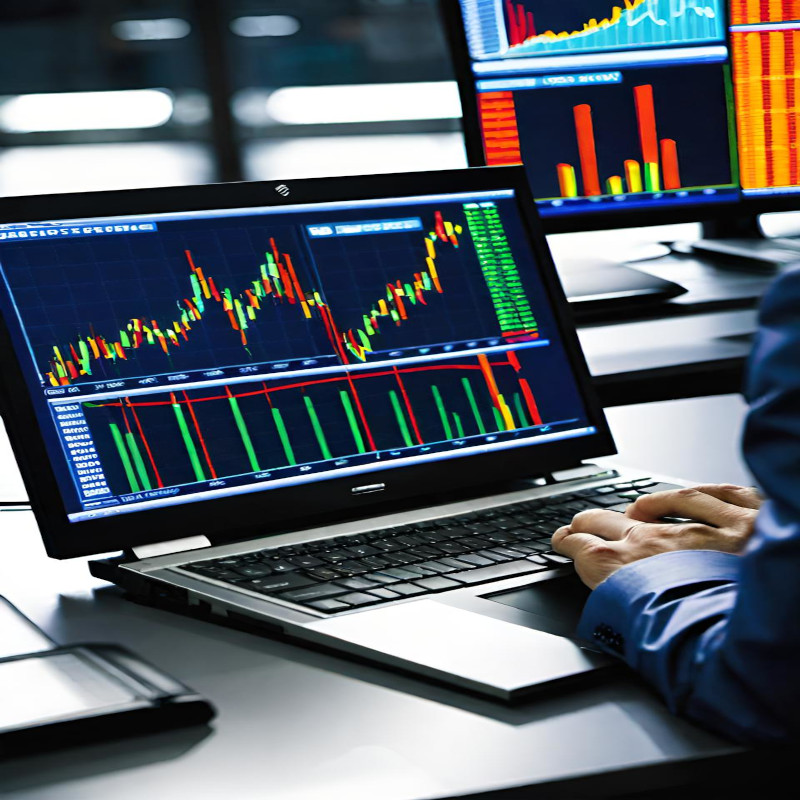
Price action is visually represented on charts, primarily through candlesticks, bars, and line charts.
These visual tools help traders see the movement of prices over time, making it easier to analyze and make trading decisions.
Candlestick charts are the most popular way to represent price action.
(Candlestick charts have a fascinating origin, deeply rooted in Japanese history. They were developed by Japanese rice traders in the 18th century to predict the future price movements of rice.)
In the realm of trading, candlestick charts are your go-to visual tool for understanding price movements over a specific timeframe.
Key Elements of Price Action on Candlestick charts

1. Candlestick Patterns:
Each candlestick acts like a tiny story, summarizing the price action for a specific period (e.g., one day, one hour, etc.).
The chart above shows a candlestick chart with many candlestick patterns showing the price behavior of Nvidia (NVDA) stock, where each candlestick represents the price behavior of a 1-day period.
Components of a Candlestick:
- Body: The wide part of the candlestick, showing the opening and closing prices.
- Green/White Body: Indicates the price closed higher than it opened (bullish).
- Red/Black Body: Indicates the price closed lower than it opened (bearish).

- Wicks (or Shadows): Thin lines above and below the body, showing the highest and lowest prices during the period.
- Upper Wick: The highest price.
- Lower Wick: The lowest price.
Most common candlestick patterns
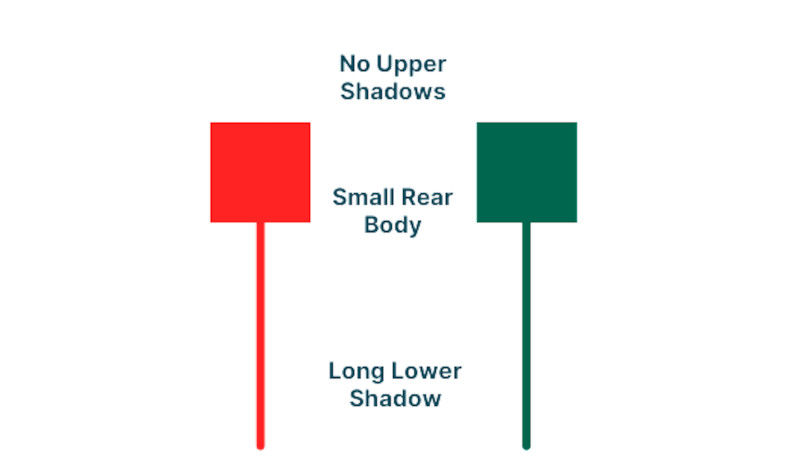
- Hammer/Hanging Man: Potential reversal signals.
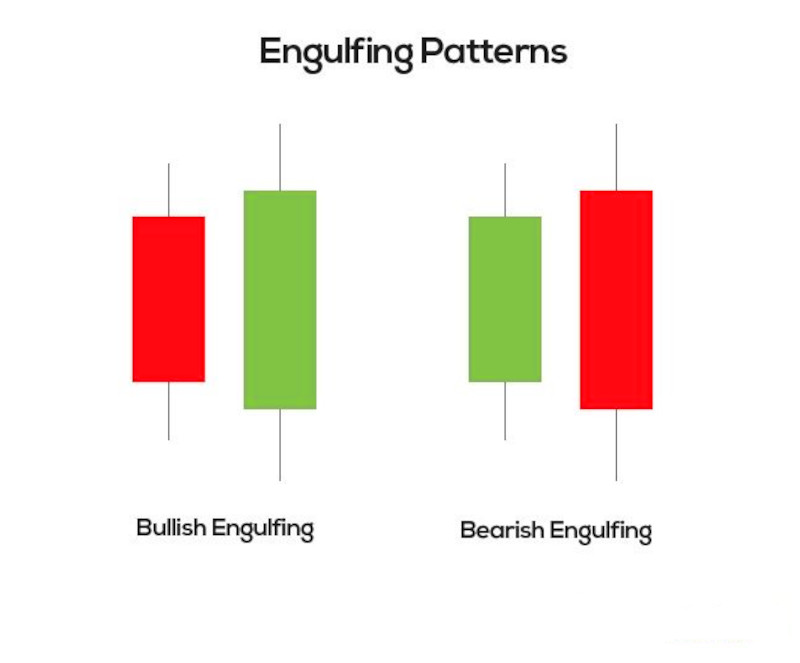
- Engulfing Patterns: Bullish or bearish, indicating strong reversal signals.
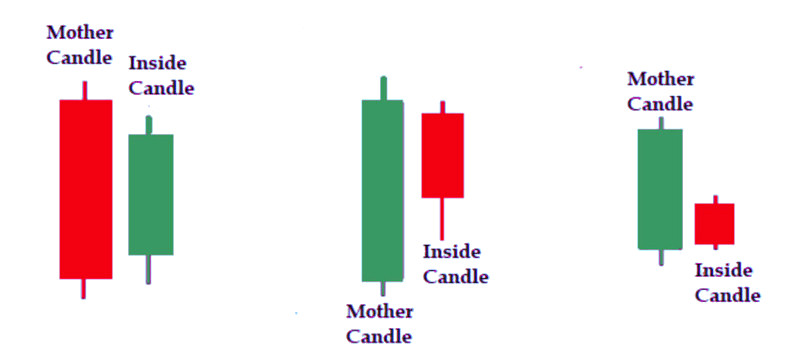
- Inside Candle: Represents consolidation before a breakout.
- Doji: Indicates indecision in the market.

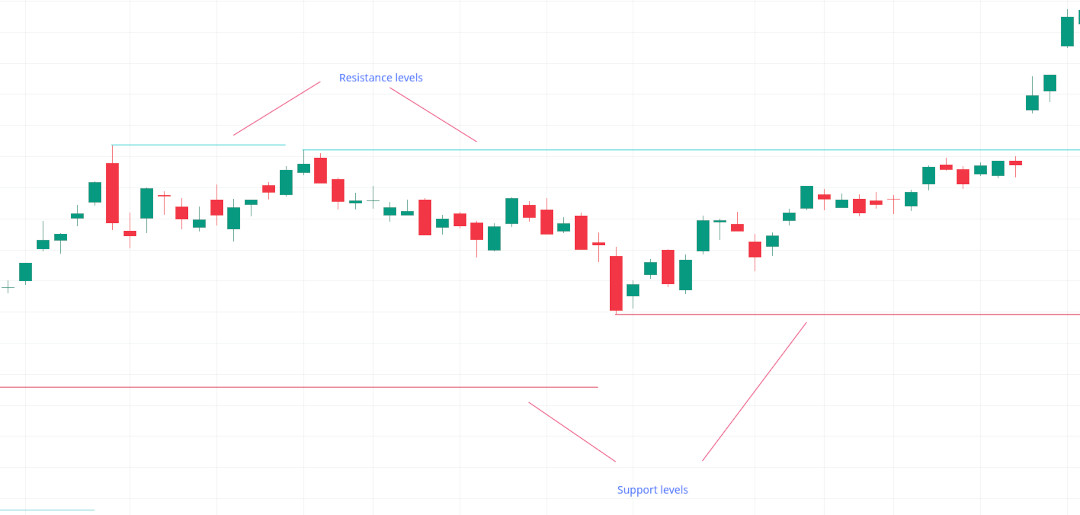
2. Support and Resistance Levels:
Support: A price level where a downtrend can be expected to pause due to a concentration of demand.
Resistance: A price level where an uptrend can be expected to pause due to a concentration of supply.
3. Trend Lines:
Uptrend: Series of higher highs and higher lows.
Downtrend: Series of lower highs and lower lows.
Sideways/Range: Price moves horizontally between a range of levels.

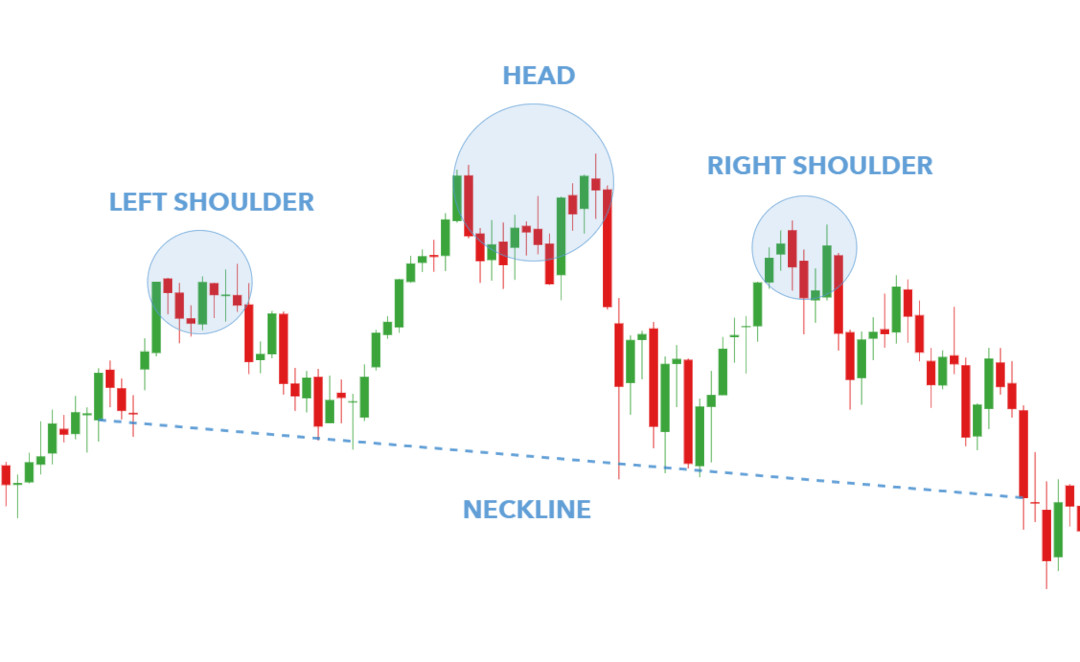
4. Chart Patterns:
Candlestick chart patterns, like the ones listed below, are useful for traders because they offer potential insights into future price movements. However, their complexity lies not just in the visual recognition but also in understanding their limitations.
- Head and Shoulders: Reversal pattern.
- Double Top/Bottom: Reversal pattern indicating potential change in trend direction.
- Triangles: Continuation patterns, could be ascending, descending, or symmetrical.
Why is Price Action Relevant?
1. Simplicity:
Price action trading is straightforward as it relies solely on price data, making it easier to understand and implement compared to strategies requiring multiple technical indicators.
2. Versatility:
Applicable across different markets and timeframes, allowing traders to adapt their strategies based on personal preferences and trading styles.
3. Direct Market Feedback:
Provides real-time information about market sentiment and the balance between buyers and sellers. This direct feedback helps traders make informed decisions without relying on lagging indicators.
4. Increased Confidence:
Understanding price action can enhance a trader's confidence as they learn to "read" the market through the lens of price movements, leading to potentially more accurate predictions and timely trade entries and exits.
5. Enhanced Risk Management:
Price action signals can offer clear entry and exit points, helping traders to set precise stop-loss and take-profit levels, thereby managing risk more effectively.
6. Market Psychology Insight:
Helps traders gain insight into the psychology of other market participants by identifying key patterns and levels where significant buying or selling pressure exists.
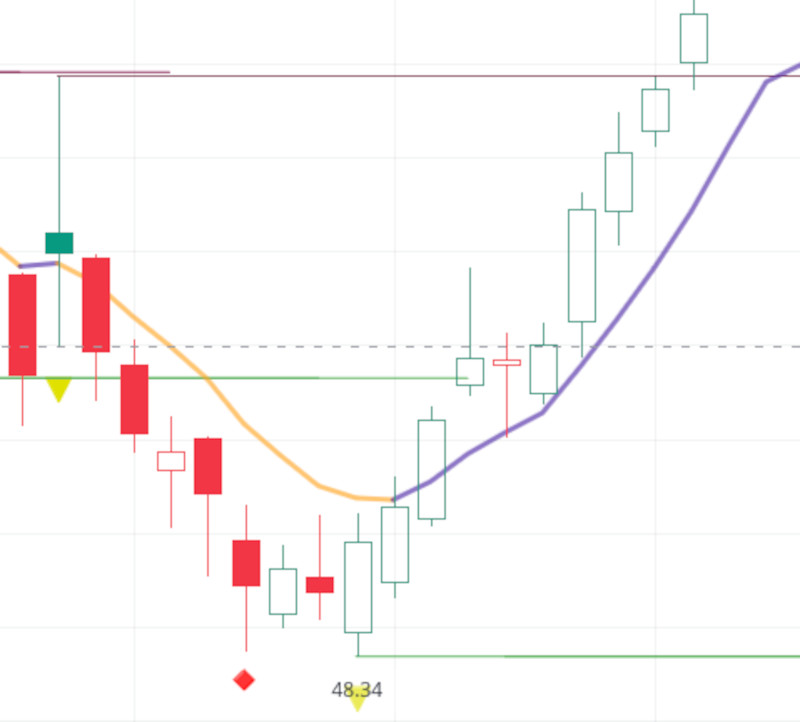
Example of Price Action Trading
Consider a stock in a clear uptrend. A price action trader might:
- Identify a support level where the price has previously bounced back up.
- Notice a bullish engulfing candlestick pattern at this support level.
- Enter a long position based on the expectation that the uptrend will continue.
- Place a stop-loss just below the support level to manage risk.
- Set a take-profit level at the next identified resistance level.
Limitations of Price Action:
Subjectivity: Interpreting price patterns and signals can be subjective, leading to different traders drawing different conclusions from the same price chart.
False Signals: Price patterns don't guarantee future price movements. There can be false signals and unexpected price breakouts.
Confirmation: Combining price action analysis with other technical indicators or fundamental analysis can provide additional confirmation for potential trading decisions.
Overall, price action is a valuable tool for traders of all experience levels. By understanding how to read price charts, identify trends, and interpret price patterns, traders can gain valuable insights into market behavior and make informed trading decisions.
Conclusion
Price action is a fundamental concept in trading that provides a clear, direct way to analyze and interpret market movements. By focusing on the core element of price, traders can develop strategies that are both simple and effective, allowing them to navigate the markets with confidence and precision.